Hello, my name is Colton Smith and this is my first hands on experience backtesting quantitative trading strategies. For the last 6 months quantitative trading has been a personal topic of interest that I have dedicated a lot of time researching to. I’m currently a senior at the University of Washington, majoring in Industrial and Systems Engineering with a minor in Applied Mathematics. Outside of my major, I have taken computer sceince courses and been heavily involved in the UW Math Club which I am now the President of. With this background and experience I have become very familiar with statistics, probability, and R. This upcoming year I will be taking more computer science courses and continuing quant projects to further prepare myself for internship and job oppurtunites.
The most logical place to begin was the Quanstrat package in R. I wanted to start with a simple strategy that would let me explore the different functions of Quanstrat and play around with some data. Being already familiar with Bollinger Bands, a volatility indicator, I thought it would be interesting to analyze them combined with RSI, a momentum indicator.
Therefore, I chose to analyze this strategy from 01/01/2010 to 12/31/2015 because no combination handled 2008 very well and I wanted consistent data to work with. The Bollinger Bands indicator used a simple moving average with n = 20 and RSI used a weighted moving average with n = 14. The buy signal was when the close was below the lower Bollinger Band and the RSI was below the lower threshold which would indicate the stock may be oversold and could mean revert upwards. The sell signal was when the close was above the upper Bollinger Band and the RSI was above the upper threshold which would indiacte the stock may be overbought and could mean revert downwards. I decided to gather data for the 150 different combinations of Bollinger Band standard deviations (1,1.25,1.5,1.75,2,2.25), upper RSI thresholds (60,65,70,75,80), and lower RSI thresholds (20,25,30,35,40). These ranges were chosen to ensure that all combinations executed a decent amount of trades during this period. Some combinations (<5%) still didn’t execute very many trades, which may have skewed some of the data. These strategies were tested on SPY with a starting account equity of $100,000 and each buy signal making a purchase of 500 shares. I chose to analyze the combination’s performance based on its CAGR, Compound Annual Growth Rate. For reference, the SPY’s CAGR in this time period was 10.6%.

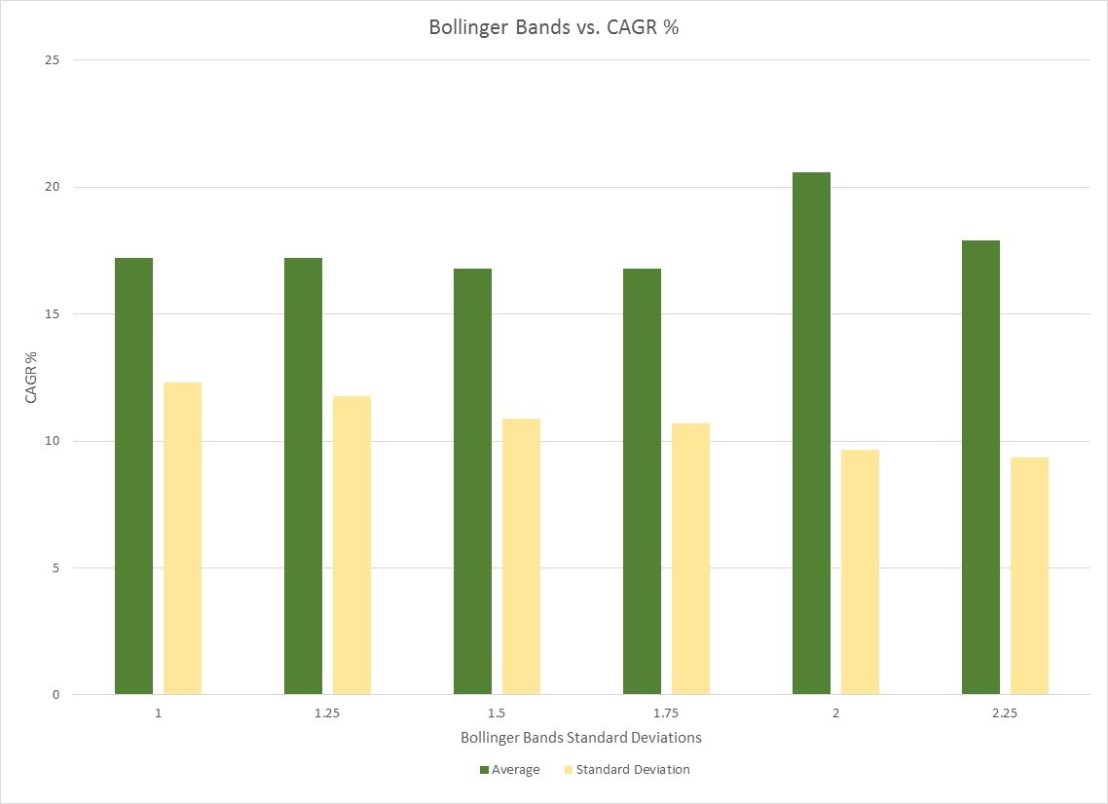
Figure 1 displays the results of each combination. The best performing combination was with Bollinger Bands standard deviations of 1 and the upper/lower RSI thresholds set at 80/40 which had nearly a 40% CAGR. Looking at figure 1 and 2 together you can see how the standard deviation of the strategy’s performance shrinks as larger Bollinger Bands standard deviations are used. This is because when starting at the beginning of figure 1, where lower standard deviations are used, the RSI thresholds are controlling the strategy. However, when the Bollinger Bands standard deviations increase, they dominate the strategy. Additionally, as displayed in figure 2, the convention that using Bollinger Bands with standard deviations of 2 for the best performance, is supported.
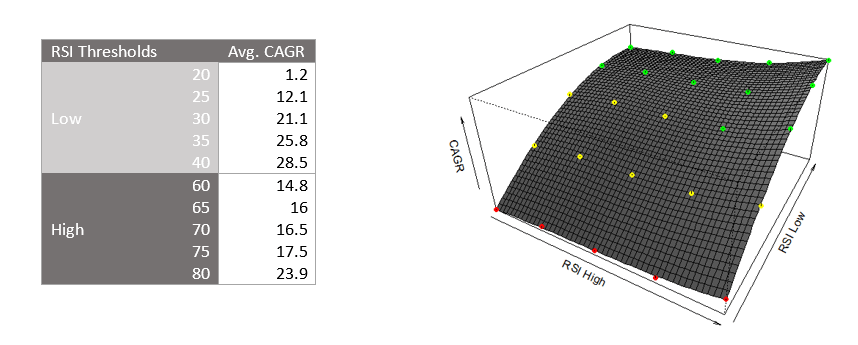
As visible from the highlighted combinations in figure 1 and from the table below, strategies with higher upper and lower RSI thresholds performed better because they bought more often and sold less frequently. I believe this worked well because of the upward market trend. The 3d surface plot below helps visualize the influence of the upper and lower RSI thresholds. This plot is with Bollinger Bands standard deviations of 2 and nicely shows how increasing the lower RSI threshold has a drastic effect on the CAGR, much more than the upper RSI threshold does. For reference, the red dots were combinations that didn’t beat the SPY CAGR, the yellow dots were ones that outperformed the SPY CAGR but were below 25%, and the green dots were combinations that had CAGR of above 25%.
Overall, this project was very helpful to learn how to work with multiple signals and paramsets in Quanstrat, as well as some data visualization techniques. Next, I plan to explore a strategy where I can utilize my statistical knowledge with one that makes much more frequent trades so I can analyze risk and profit factors.
Acknowledgements: Thank you to Ernest Chan, Ilya Kipnis, and Brian Peterson for answering my elementary questions about Quantstrat and backtesting.
