Counting Blackjack has become an interest of mine over the past few months. After learning the basics of the Hi-Lo counting strategy I thought it would be beneficial to analyze how much time I should expect to have the advantage during my trips.
The Hi-Lo Count is the most used and discussed counting strategy for Blackjack because of its simplicity and effectiveness. Each card is given a value of either -1, 0, or +1. The low cards (2-6) are given values of +1. The neutral cards (7-9) are given values of 0. The high cards (10-Ace) are given values of -1. At any point in the shoe, the running count is the summation of card values dealt up until that point. The running count at the beginning of the shoe is zero and if all cards of the shoe were dealt, it would end at zero. To calculate the true count, the running count is divided by the number of decks remaining in the shoe. This standardizes the true count, so it is comparable at any point of the shoe. The true count represents the player vs the house edge and instructs the player to increase their bet when the advantage is in their favor. The player’s advantage increases as the true count increases because there are more high cards left in the shoe, which then gives the player better hands and causes the dealer to bust more frequently. When playing perfect basic strategy, the player begins to have the advantage when the true count (TC) becomes larger than +1. If you’re interested in the details of basic strategy, card counting, and expected value, I encourage you to check out the available resources online that cover these topics thoroughly.
This advantage from counting can vary based on the number of decks being used and the depth of penetration (how far into the shoe the dealer places the shuffle card). It is widely preached that the player has a larger positive expected value when fewer decks are used with deeper penetration. Therefore, many casinos deal 6+ decks with penetration as low as 60% to make it more difficult for players to get an advantage.
To quantify the impact of penetration and the number of decks on the advantage from counting cards, I ran rudimentary simulations that dealt through shoes, one card at a time, while keeping track of the true count at each point. To start, I simply plotted the different paths of true counts for different shoes. In Figure 1 below, the paths of 1000 simulations with a shoe of 5 decks and poor penetration are shown. The true count never passes +/-10.

Since the true count depends on the number of decks remaining in the shoe, having deeper penetration can result in more extreme true counts. In Figure 2 below, the same amount of decks are used but now the shoe is dealt entirely through.

In all simulations the true count must end at zero since the running count of an entire shoe is zero. These situations when the true count is high and reverts back to zero are where the advantage from counting pays dividends. It is also clear from the simulations that the variance of the true count increases as the penetration becomes deeper which gives rise to more of these profitable periods. These periods also will return to neutral quicker though. A +5 TC could return to zero in one hand (5 cards) if there is only one deck remaining in the shoe. A +5 TC with 3 decks left would take 15 face cards to return to zero.
Next, to visualize how these simulations compare across different combinations of decks and penetration, I needed to choose what variables mattered. The average number of points per simulation where the TC > 2 quantifies the amount of points with a player advantage. Since this is dependent on the shoe size, these values were divided by the shoe size to give the percent of shoe with the advantage. Additionally, the variance of the true count was monitored because as we saw previously, a larger variance may amplify the advantage. The results are presented in Figure 3 below.
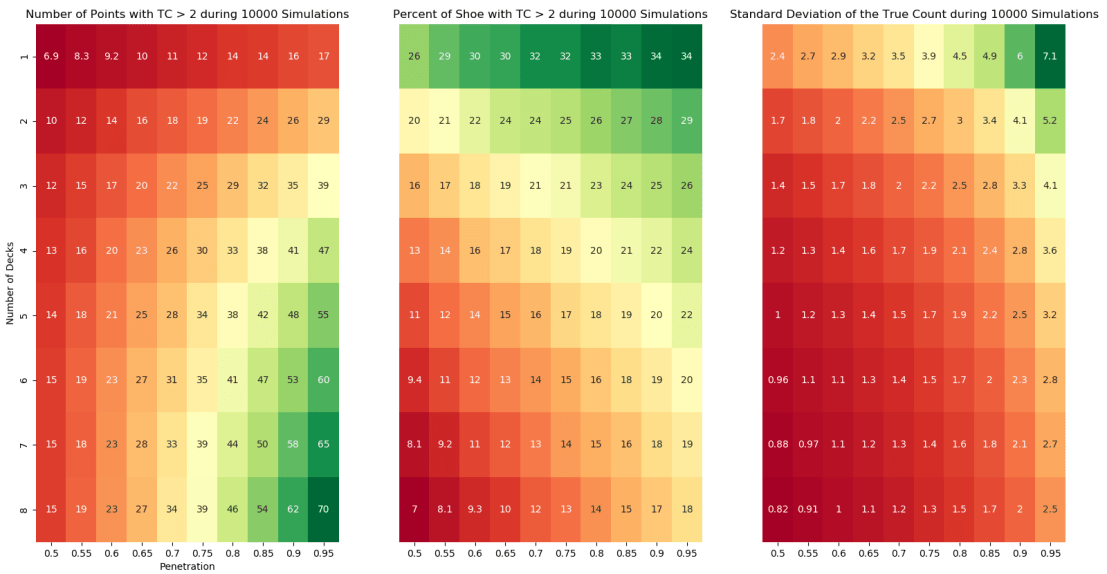
These findings are consistent with previous analysis of Blackjack. The player can expect to spend the most time with the advantage in games using fewer decks and deeper penetration. The value of this advantage time is also improved by a larger variance. The variance is more dependent on the depth of penetration than the number of decks, but both affect its value. If we look at a standard game available at many casinos of 6 decks with 65% penetration, the player will have the TC > 2 for 13% of the shoe on average with a TC standard deviation of 1.3. If we were to find a 2-deck game with 90% penetration, the player will have the TC > 2 for 28% of the shoe on average with a TC standard deviation of 4.1. If these games have the same rules, the player will gain more of an edge with fewer decks and deeper penetration.
The code for generating this analysis can be found on Github here. An interesting topic to explore next would if the path that the TC takes when reverting back to zero affects expected value and if so, how?
Acknowledgements: Thank you to James Sweetman for helping me better understand the Blackjack concepts.
