Hello all! For my second post I decided to analyze an aggressive short-term strategy. While researching, I found a good amount of literature supporting the potential of SMA 200 and RSI 2 strategies, so it seemed like a solid place to begin. I was also reading through previous posts on the Quantstrat Trader blog and ATR position sizing caught my attention so I decided to add it to the strategy (https://quantstrattrader.wordpress.com/2014/06/11/trend-vigor-part-iii-atr-position-sizing-annualized-sharpe-above-1-4-and-why-leverage-is-pointless/). Parts of the code and analysis later in this post was influenced by the Quantstrat Trader blog and Ilya Kipnis himself, so a big thank you to him! Though the tested strategies proved to not be as successful as I had originally hoped, I was able to draw valuable conclusions from the data while improving my backtesting skills.
To start, I analyzed 2 variations of a strategy that used 4 indicators. In my previous post, the Bollinger Bands and RSI strategy used a 14-period RSI indicator. This strategy uses a 2-period RSI, which makes it a much more sensitive momentum indicator. Two simple moving averages, 5 and 200, were used to track short and long term market trends respectively. Finally, a lagging average true range (ATR) indicator, provided by the IKTrading package, was used to monitor market volatility. This allowed me to adjust trade sizes and normalize risk. The first version of the strategy, V1, uses the 200-day SMA to determine the market trend direction (closing price above/below) and the 2-period RSI to identify overbought/oversold situations that could mean revert. It then makes quick exits, hopefully closing a profitable trade on the long or short side, when the mean reversion is done, indicated by the closing price and 5-day SMA relationship. The signals are shown below:
- Enter long: Close > SMA 200 & RSI 2 < 20
- Enter short: Close < SMA 200 & RSI 2 > 80
- Exit long: Close > SMA 5
- Exit short Close < SMA 5
The second version of the strategy, V2, is similar to V1 except it only enters long side positions and has an additional exit signal based on the 2-period RSI. The signals are shown below:
- Enter long: Close > SMA 200 & RSI 2 < 20
- Exit long: Close > SMA 5
- Exit long: RSI 2 > 80
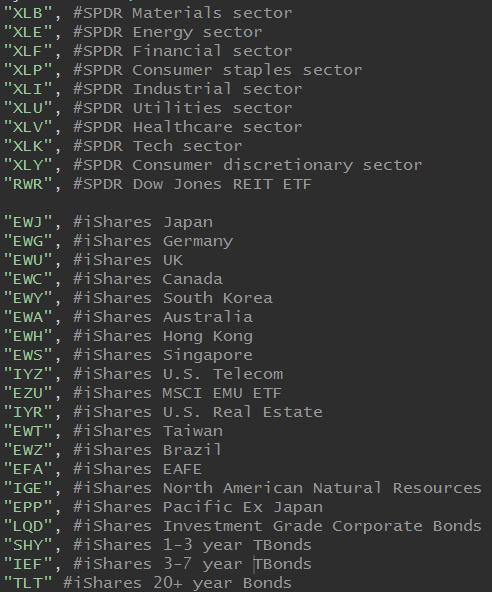
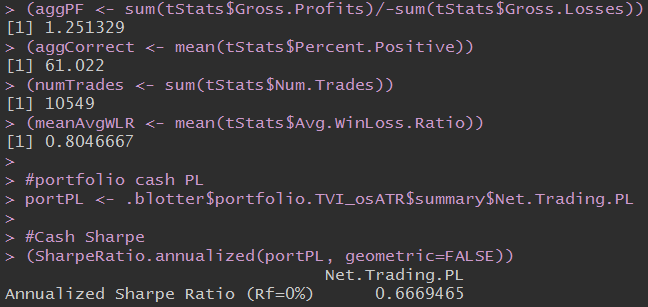
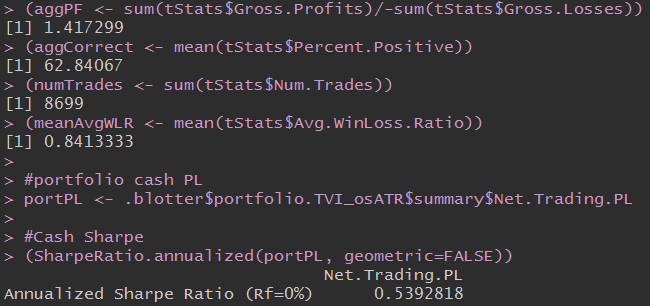
Both of these strategies were ran with an ATR position sizing function, using a 20-period moving average and risk percentage of 2%. They were backtested on the following ETFs from 2003-2016, and SPY from 2010-2016/2000-2016. The metrics primarily used to analyze the results were profit factor (gross profits/gross losses), percent positive, and annualized Sharpe ratio. Both strategies made about ~10,000 trades across the ETFs 13 year period. Together these metrics give a fairly complete view of the strategy’s profitability and risk factor.
Strategy V1’s Performance

| SPY | 2010-2016 | 2000-2016 | ||
| ATR? | No | Yes | No | Yes |
| Percent Positive | 63.5% | 62.8% | 64.6% | 64.5% |
| Profit Factor | 1.59 | 1.31 | 1.72 | 1.44 |
| Annual Sharpe | 1.99 | 1.51 | 2.27 | 2.08 |
Overall, with or without ATR position sizing, this was not a winning strategy as implemented. Most surprisingly, position sizing negatively impacted the profit factor, percent positive, and annualized Sharpe. The strategy did display its ability to adjust to market volatility.
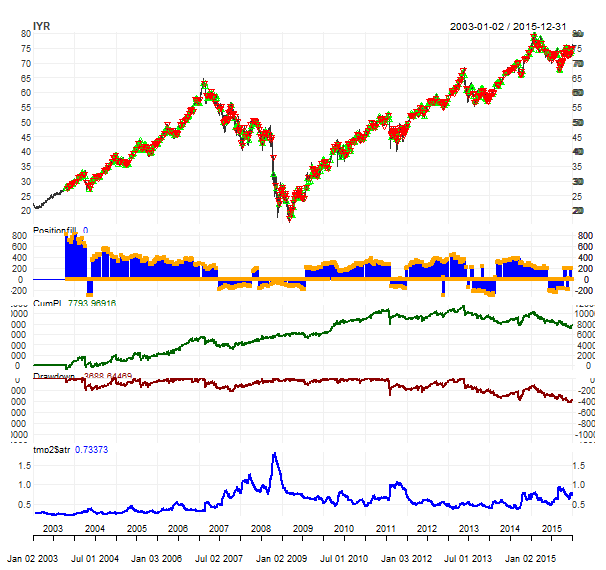
The above figure shows the strategy’s performance on IYR, the US Real Estate ETF. Looking at the ETF price, position fill (blue columns), and ATR indicator (bottom blue line), you can see the gradual reduction in position sizing leading up to the 2008 recession and the transition to short side positions. The implementation of the ATR position sizing was a definite success in appropriately adjusting the trade sizes based on market volatility which is shown nicely in this figure.
After analyzing the position fill on this ETF as well as others, a common flaw of this strategy seems to be holding long positions too long into a downturn and consequently not entering short positions soon enough. As visible in the figure above, these transitions are quite mistimed. If this strategy could improve these timings I believe it would drastically improve its profitability.
Strategy V2’s Performance

| SPY | 2010-2016 | 2000-2016 | ||
| ATR? | No | Yes | No | Yes |
| Percent Positive | 60.7% | 64.8% | 61.4% | 63.7% |
| Profit Factor | 1.55 | 1.48 | 1.40 | 1.33 |
| Annual Sharpe | 1.59 | 2.15 | 1.20 | 1.66 |
The results of this strategy told a slightly different story. Across the ETFs and SPY, the profit factor was negatively affected by ATR position sizing, but the Sharpe ratio was improved. Initially I hypothesized that the ATR position sizing should increase the Sharpe ratio since it prevents huge losses by decreasing risk volatility, so this was exciting to see.

Once again, visible in the above IYR figure above, the strategy does a fairly good job at sitting out severe downtrends. Strategy V1’s trade-side distribution was about 80% long and 20% short so this strategy was essentially just the long trades with the additional exit signal that may or may not have been beneficial.
I also tested these strategies with more sensitive signals by changing the RSI thresholds to 90/10, but that did not improve their performance. Overall, these strategies let me experiment with a short term trading strategy and the metrics used to evaluate them, which will be useful in future projects. With regard to the ATR position sizing, I strongly believe that it would be much more helpful when applied to a long term trading strategy. In the case of a short term trading strategy, the trade sizes become essentially irrelevant as the number of trades increases making the strategy’s percent positive, win-loss ratio, etc. more important. In a long term trading strategy where positions are potentially held for months, the trade size is much more important. Based on the qualitative impact ATR position sizing had on this strategy, I now understand how much of an essential risk management tool it is.
Another tool used to help adjust for risk that I want to incorporate into my next strategy is trailing stops. The figure below is the MAE plot for strategy V1 which can be used to determine an appropriate trailing stop. For example, a trailing stop of 4% added to this strategy would cut a significant portion of the losses.

Now that I have a basic understanding of Quantstrat and evaluating strategy performance, I plan to focus on finding more profitable strategies in my next projects. I still want to dive into something a little more statistically/mathematically dense. Currently I am taking an advanced applied mathematics course, so maybe I’ll get some ideas in there! Additionally, I eventually want to incorporate machine learning into a strategy. Thanks for reading!

here is an interesting strategy using the average true range indicator
LikeLiked by 1 person